Power BI Interview Questions You Should Prepare For
June 10, 2025
•
Interview Preparation
This is some text inside of a div block.
What is Power BI?
Power BI is a data visualization tool by Microsoft. It helps people see and understand data. Say you want to make a smart business choice - Power BI will help you a lot.
It shows charts, graphs, and dashboards, so users can get meaning from raw numbers. Sometimes teams need to work together. If that happens, Power BI lets them share reports easily. This is the reason many companies use it for planning.
By this way, leaders know what is working and what needs to change. It is simple, but it helps business a lot.
Team analysing Power BI dashboard with charts, graphs, and KPIs in a modern office setting.
What are Power BI interview questions?
Well, Power BI interview questions try to see how you use the tool in real tasks. If you know how to build models, then you are more likely to give better answers. Sometimes the focus is on charts or reports. This is the reason many questions look at how you show and explain data.
Why do interviewers ask Power BI questions?
Interviewers ask Power BI questions to know how much you can do with data. They look for your skill in making reports. Say you get a question about charts — this is how they check your knowledge. If you can turn data into clear visuals, then you are more likely to pass. So, the goal is to find out if you can read data and show what it means. By this way, they see if you are ready for real work.
30 Power BI interview questions
1. What is Power BI?
Why You would be asked this: Well, this checks if you know what the tool does at a basic level. It is likely to be the first question in many interviews. This is why they ask it — to see if you understand the main idea of Power BI.
Example Answer: Power BI is a tool from Microsoft. It is used for business data. Say you have numbers in a file — Power BI can show them as charts. This is how people see patterns more clearly. It connects to many kinds of data. So, if the data is stored in Excel, SQL, or a cloud service, it can work. Sometimes the data is not clean. Power BI can fix that before showing it. By this way, users get reports that are easy to read. The goal is to help people make better choices.
2. What are the key components of Power BI?
Why You would be asked this: The question helps the interviewer check if you know how Power BI works as a full system. Sometimes users only use one part. It shows if you understand all tools in the set.
Example Answer:Power BI has five main parts Power BI Desktop, Power BI Service, Power BI Mobile, Power BI Gateway and Power BI Report Server.
3. What is DAX in Power BI?
Why You would be asked this: DAX is mainly essential for data modelling and calculation. So, the goal is to test your ability to build smart calculations.
Example Answer:DAX stands for Data Analysis Expressions. It is a language made for Power BI. By this way, users create calculated columns. It also works for measures and custom tables. Sometimes the need is to filter or sum data in a special way.
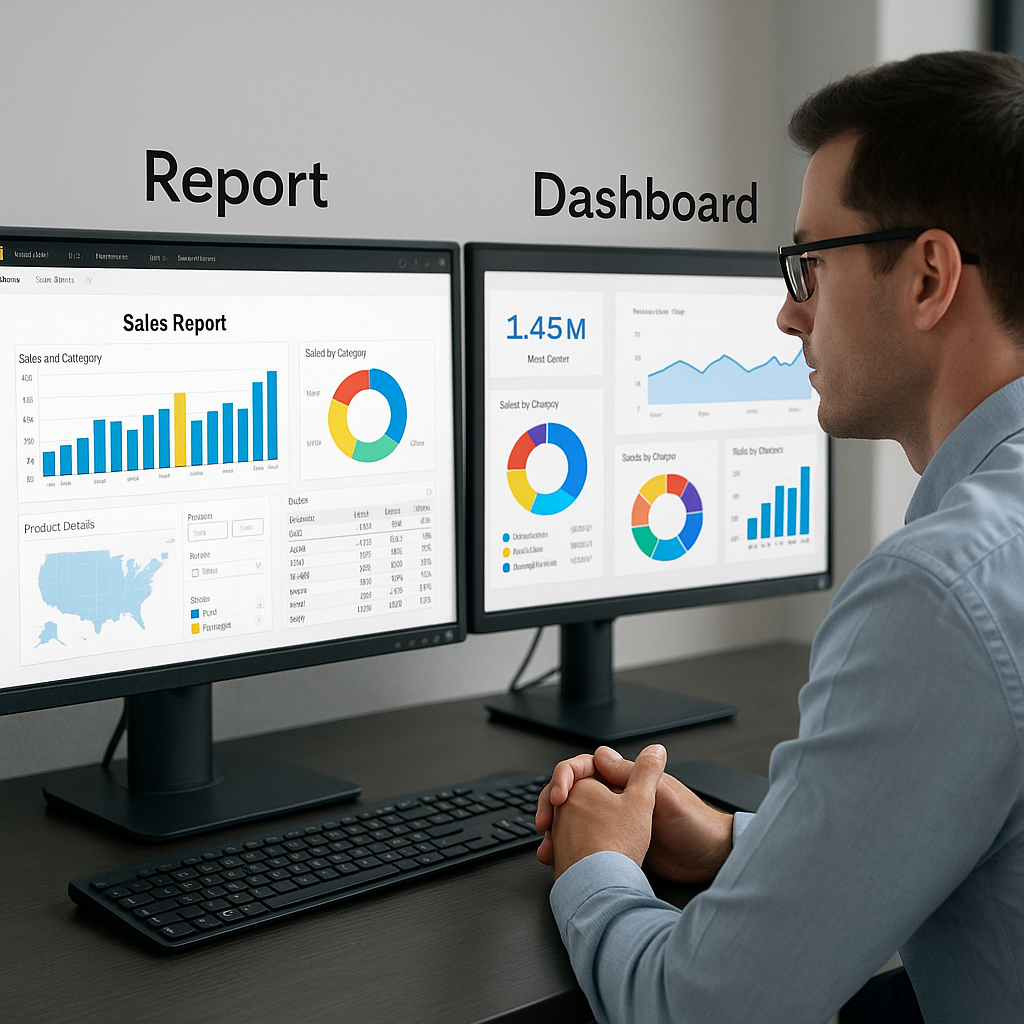
4. What is the difference between a dashboard and a report in Power BI?
Why You would be asked this: Sometimes people mix the two, so this is why interviewers want to be sure and to verify your understanding of Power BI’s UI and usage.
Example Answer: A report has many pages. It shows data through different visuals. A dashboard only has one page. It shows key visuals in tile format. Sometimes it takes visuals from more than one report.
Professional analysing Power BI dashboard and multi-page report side by side on dual monitors in a modern office.
5. How do you handle large datasets in Power BI?
Why You would be asked this: Large data can slow things down. So, they want to see if you can manage size and speed at the same time.
Example Answer: Use filters to remove what is not needed. Apply aggregations to reduce row count. By this way, you make the file smaller. Sometimes star schema helps the model run faster. Use Direct Query if live data is needed. But avoid it if the source is slow.
6. What is the difference between Import and Direct Query mode?
Why You would be asked this: This question was often asked. If you choose the wrong mode, then your report might not work well. It shows how you think about speed and data freshness.
Example Answer: Import brings the data into Power BI. So, the report works faster after loading. Direct Query keeps the data at the source. By this way, it shows updates in real time. But it may slow down the report. Sometimes the source is not fast enough.
7. Explain relationships in Power BI.
Why You would be asked this: Reports often use data from many tables. If you do not set them right, then your results may be wrong.
Example Answer: A relationship links two tables. One table has customer names and the other has orders. You can connect them with a key. One side has unique values, and the other side may have repeated ones. By this way, Power BI can use all the data in one report.
8. What is the Power Query Editor?
Why You would be asked this: Working with raw data is common in Power BI. This is the reason they ask about Power Query. If you cannot clean or shape data, then your reports may not work.
Example Answer: Power Query Editor helps us prepare data. It connects to many sources. You can filter, sort, and rename in it. Sometimes the data needs to be split or merged. It does not load to the report until you apply the changes.
9. How do you implement row-level security (RLS) in Power BI?
Why You would be asked this: Everyone shouldn’t see all data. This is why the question checks if you can limit access. So, the interviewer wants to see how you manage that part.
Example Answer: RLS is Start by opening Power BI Desktop and then create roles. Use a DAX filter for that. Set the rule inside the role. By this way, the data changes based on who opens the report is published.
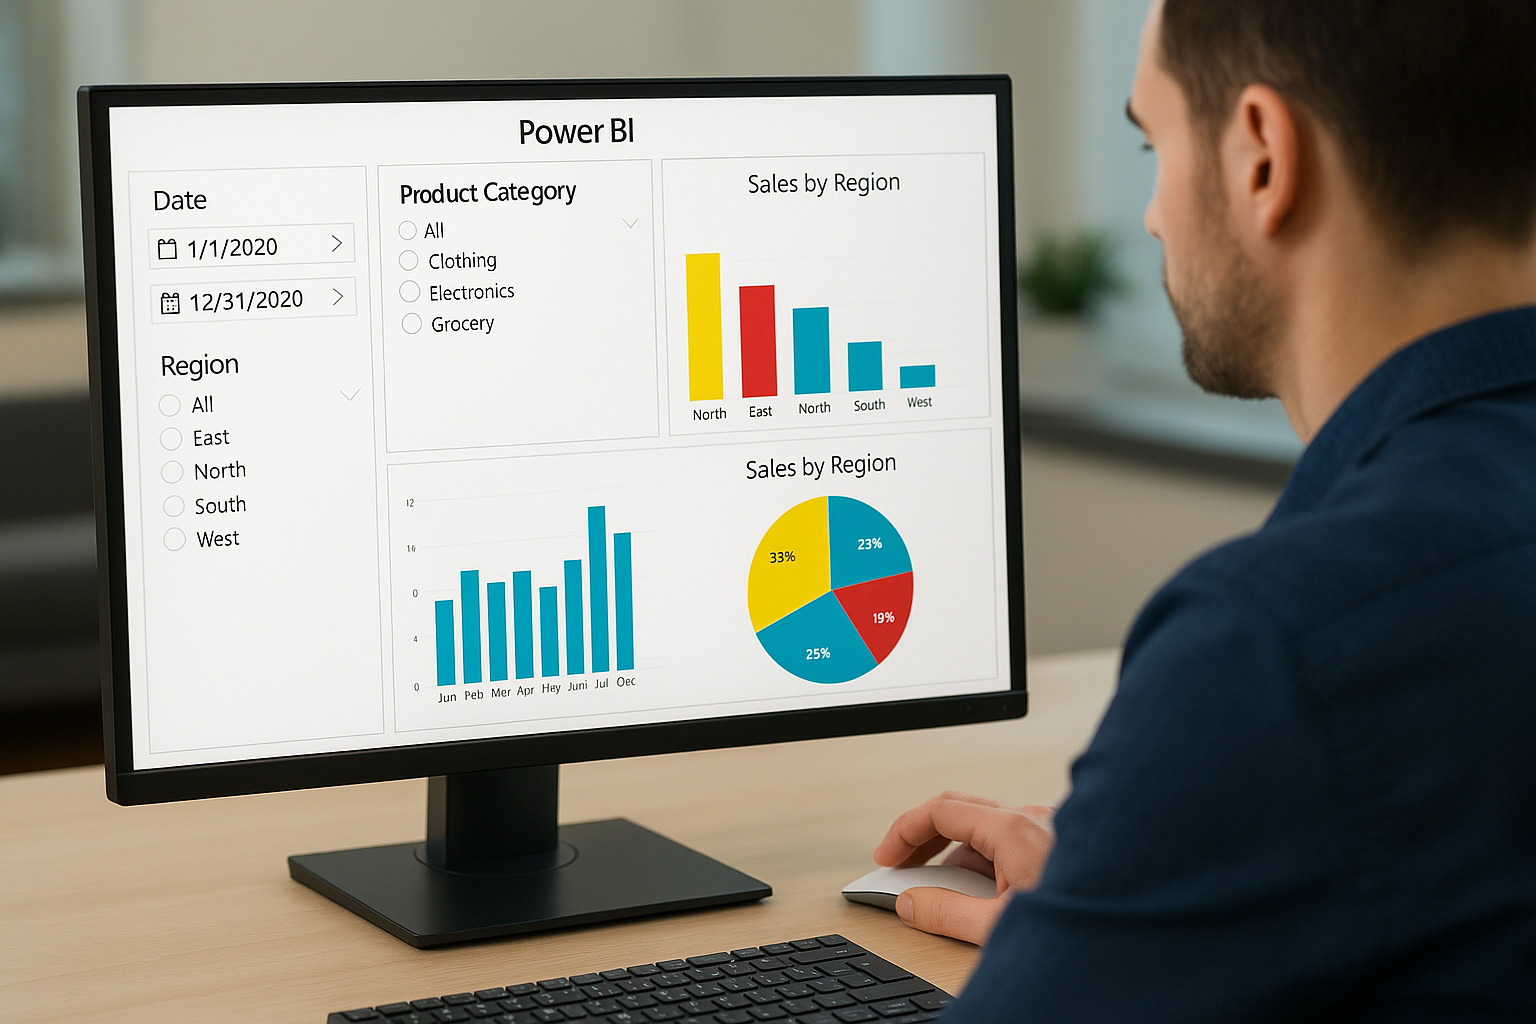
10. What are slicers in Power BI?
Why You would be asked this: Reports need to be easy to explore. If users can’t pick what they should want to see, then the report is not useful. So, the question looks at how well you handle interactivity.
Example Answer: A slicer is a visual filter that you can click. It changes the data on the screen and users get control without opening the model. Sometimes you add slicers for date, category, or region. Slicers help users move through the data fast.
Professional interacting with a Power BI report on a computer screen, adjusting slicers for date, category, and region beside bar and pie charts in a clean, modern workspace.
11. How do you optimize performance in Power BI reports?
Why You would be asked this: Slow reports can create problems. If many people open the report, then speed matters a lot. So, Interviewer or companies check how you handle performance.
Example Answer: Use fewer visuals, remove extra data that is not used and as result the file stays light, optimize DAX, Avoid too many calculated columns. Use aggregations and Star schema is better for this.
12. What are bookmarks in Power BI?
Why You would be asked this: The report should help users move and see changes. If you use bookmarks, then users likely get a better view. So, the goal is to know if you can make the report easy to use.
Example Answer: A bookmark saves the report’s view. you set filters and want to return later - use a bookmark. It keeps the same visuals and filters settings. It useful for navigation, creating costume views and storytelling. It helps in both telling a story and showing key data fast.
Power BI report with Bookmarks pane open showing View 1, View 2, and Story Mode alongside bar and pie charts on a desktop screen.
13. How do you refresh data in Power BI?
Why You would be asked this: Reports should not show old data. If the data is not fresh, then people may make wrong choices. So, you can keep data up to date.
Example Answer: I refresh data manually in Power BI Desktop. In Power BI service I use scheduled and sometimes use a gateway to reach data from my own network.
14. What is a calculated column vs a measure?
Why You would be asked this: This is the common question in these interviews. Both are different things but they part of DAX work. So, you shouldn’t mix them up, if you mix them your model may not work well.
Example Answer: A calculated column makes a new column in the table. It gives one value based on filters. Follow this way, you can show totals or averages. A measure performs calculations on aggregation and is used in visuals.
15. How do you share Power BI reports?
Why You would be asked this: Reports are not just for one person. If others cannot see the reports, then it has no real use.
Example Answer: You can use Power BI Service to share and publish it to workspace, creating dashboards, or embedding reports in apps or websites.
16. What is a star schema and why is it preferred in Power BI?
Why You would be asked this: Reports are not just for one person. If others cannot see the reports, then it has no real use.
Example Answer: You can use Power BI Service to share and publish it to workspace, creating dashboards, or embedding reports in apps or websites.
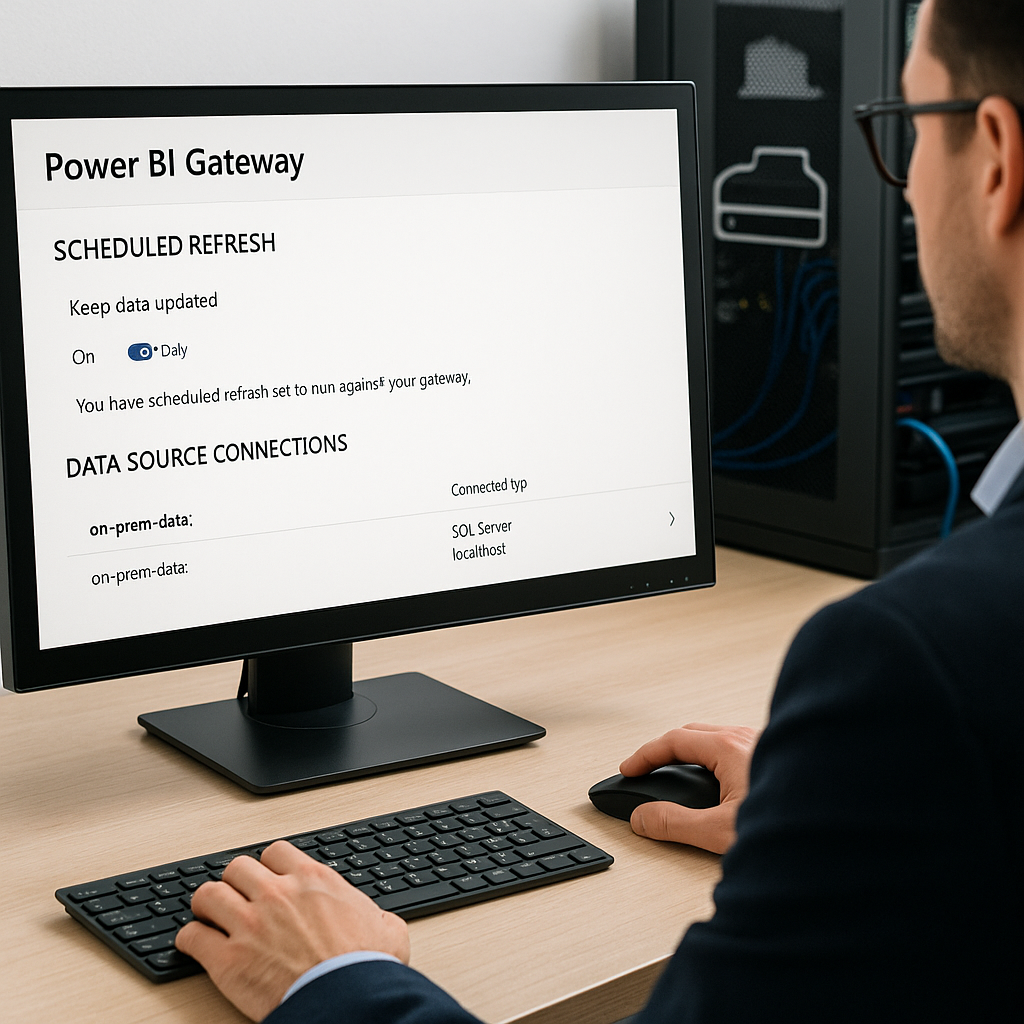
17. What is Power BI Gateway?
Why You would be asked this: All data isn’t stored in the cloud. If the data stays on local servers, then you need a way to reach it. So, they want to know that what you understand how to connect Power BI to that kind of data.
Professional configuring Power BI Gateway with scheduled refresh and on-premises SQL Server data source on desktop screen.
18. How can you handle many-to-many relationships in Power BI?
Why You would be asked this: All tables haven’t simple links. If two tables share values in a complex way, then the wrong setup gives bad results. This question checks your model skill..
Example Answer: I use a bridge table to resolve many -to- many relationships in Power BI. Each side connects to that bridge. This way, I control the relationship. Power BI allows direct many-to-many links now. But I test it well before using. So that filters and totals stay correct.
19. What is the difference between Power BI Pro and Power BI Premium?
Why You would be asked this: To evaluate your grasp of licencing models and capacity planning strategics. So, they check if you know what fits each case.
Example Answer: Power BI Pro is for one person. It needs a license for each user. Premium is different. Itgives more space, better speed and dedicated capacity for large organization. So that all users get good access without delay.
20. What is the use of the CALCULATE () function in DAX?
Why You would be asked this: This question was asked many times in this interview. CALCULATE is one of the most powerful and essential DAX functions. If you know it well, then you can build smart measures. So, the question helps test your DAX skill.
Example Answer:CALCULATE modifies the filter. It lets you apply conditions. By this way, you make totals with rules and control what the data shows. It works with many other DAX functions too.
21. How do you handle circular dependency errors in Power BI?
Why You would be asked this: Model errors stop the report. If you can’t solve it, then maybe the report will not work at all. So, the interviewers checks your thinking and logic.
Example Answer: A circular error happens when one part depends on another that also depends on it. I first check each formula. Then I find what depends on what. To fix it, review dependencies and use variables or measures where needed.
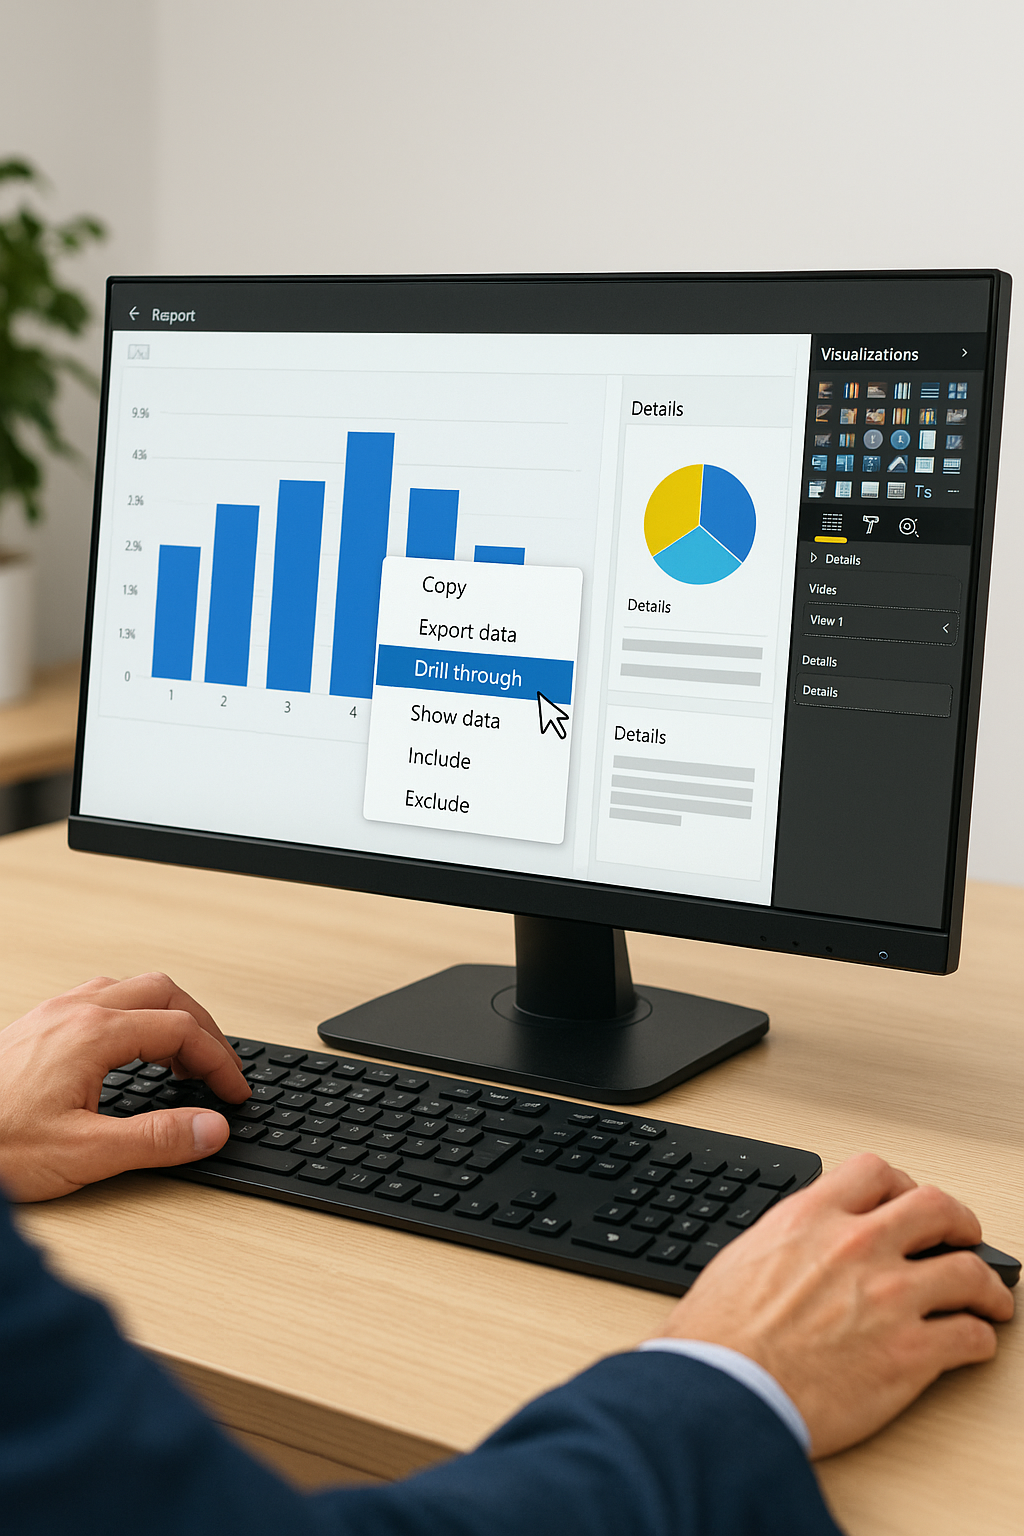
22. What is Drillthrough in Power BI?
Why You would be asked this: Reports need to give more than totals. If users want to explore details, then this tool helps him. So, the question checks if you can build reports that go deeper.
Example Answer: Drillthrough sends the user to another page by right click a data point and navigate to a detailed page about the context, improving report interactivity. It’s show details without crowding the main report.
User selecting Drillthrough on Power BI report with bar and pie charts in a modern workspace.
23. What are custom visuals in Power BI?
Why You would be asked this: In Power BI not all reports look good with default visuals. If you know how to add them, then your reports are likely to stand out more. So, the question checks how far you can go beyond the basics.
Example Answer: Custom visuals are additional visuals created by developers for special needs and it’s available from the marketplace. It could be a map or a heat graph. So, I use custom visuals when the default options are not enough.
24. What is Q&A in Power BI?
Why You would be asked this: Many users didn’t know how to build visuals and for this Q&A is useful. If someone can ask a question with simple words, then they may still find answers. So, the question checks if you understand how this helps more users.
Example Answer: Q&A lets people type questions with natural language and Power BI generates visuals based on the data model, improving accessibility for non – technical users. It reads the words and looks at the model. Sometimes the answer updates as you type. So, users who do not know DAX can still explore the data.
25. Explain composite models in Power BI.
Why You would be asked this: Sometimes data comes from different places. So, composite models are useful. If you know how to mix Import and Direct Query, then you can handle more types of projects. So, the question checks if you can build flexible models.
Example Answer: A composite model uses two modes. Between them one table is loaded with Import and another one stays live through DirectQuery. Power BI lets work in the same report. This supports flexibility in modelling and real time scenarios.
26. How do you use tooltips in Power BI?
Why You would be asked this: Users may want more detail without clicking. If you design reports with tooltips, then users likely find answers faster. So, the question checks how you think about report experience.
Example Answer: A tooltip shows extra data when hovering over a visual. Sometimes I make a full page as a tooltip. By this way, I can show more visuals in a small space. It helps when I want to keep the main page clean and for both quick checks and deep views.
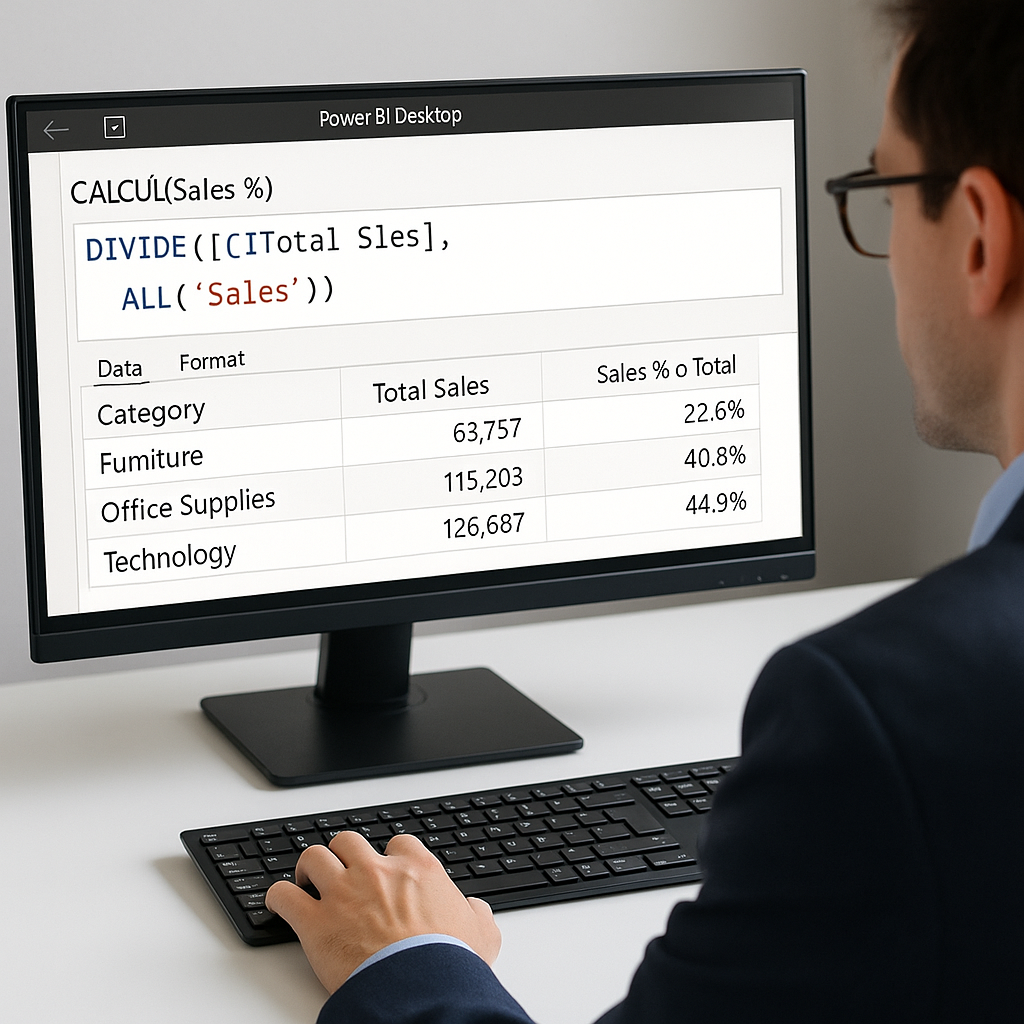
27. What is the use of ALL() function in DAX?
Why You would be asked this: Filters change results. If you want to control totals, then you must know how to remove filters. So, the interviewer ask this to check your filter logic.
Example Answer: ALL() clears filters. It works on columns or tables. It usually used to create percent of total across the entire database. Sometimes it used inside CALCULATE. ALL() used to reset the filter and get full values.
Professional using Power BI Desktop to write DAX formula with ALL() function for calculating sales percentage by category.
28. How would you track user interaction in a Power BI report?
Why You would be asked this: Reports are not just for one person. If others cannot see the reports, then it has no real use.
Example Answer: You can use Power BI Service to share and publish it to workspace, creating dashboards, or embedding reports in apps or websites.
29. Can Power BI connect to real-time streaming data? How?
Why You would be asked this: Sometimes data changes fast. If a user needs the latest value, then real-time setup matters. So, the interviewer checks if you know how to build that flow.
Example Answer:Yes, Power BI can use real-time data using streaming datasets or Azure Stream Analytics. By this way, I send data from other tools into Power BI. So, the report updates without a refresh. That helps when tracking time-based values.
30. How do you handle errors in Power Query?
Why You would be asked this: Errors stop the data from loading right. If the data has issues, then the report may break. So, the interviewer wants to check if you can fix problems before loading.
Example Answer: I check the steps one by one. Use “Remove Errors”, “Replace Errors,” or conditional logic in Power Query. I test each step to make sure the query works. So, I stop the error before it reaches the report.